
With the stagnant economy, cost control has become the new mantra of every business. Businesses are deploying various strategies to contain costs and maintain profitability. Amongst such strategies is control and visibility into spending with external suppliers.
Spend analytics is the process of aggregating, cleansing, and analyzing corporate spending data for the purpose of reducing costs and improving operational performance. According to industry analysts, businesses deploying spend analytics have been able to reduce spending by 12% based on weighted average. If spend analytics is so critical, why are organizations facing difficulties?
Here are top hurdles to deploying a spend analytics capability that you need to know about:
Hurdle #1: Disparate Data Sources
Spend analytics requires consolidation, aggregation and processing of spending data from multiple heterogeneous data sources: accounts payable (AP), procurement card (p-card), general ledger (GL), enterprise resource planning (ERP), automated clearing house data (ACH) and others.
Hurdle #2: Inaccurate and Incomplete Spending Data
The information is often riddled with errors and incomplete data; therefore it needs to be validated and cleansed before it can become usable and valuable for the purpose of categorization and analysis.
Hurdle #3: Limited Categorical Expertise
Correcting spend data often involves extensive collaboration with business subject matter experts (SMEs) to fill in data gaps and develop useful classifications or spend taxonomies.
Hurdle #4: Incongruent Spending Conventions
Multiple part numbers assigned to one product, multiple vendors codes assigned to one vendor, multiple naming conventions due to newly acquired businesses - all of these need be reconciled, resolved and managed.
Hurdle# 5: Limited Analytics Capabilities
The vast majority of businesses still rely on relational databases and excel spreadsheets to analyze their data. This practice limits the breadth and depth of analysis. It also hampers process repeatability, efficiency and speed at which spend analytics can be executed.Deploy Best Practices in Spend Analytics with Neubrain
Neubrain’s Spend Analytics system can load, cleanse, rationalize and analyze data coming from various data sources. Intelligent analysis screens can help your team research, correct, classify and analyze spend using slice and dice, key word search, drill anywhere, and drill through to source data methods to be able to rank spend categories, research suppliers, identify patterns and trends. Additionally, our system provides process automation logic and integration between analytical activities. It is designed to fit your business’ unique requirements without any programming or changes to your existing source code. Our Spend Analytics system is deployed quickly, easily maintained, and offers you a high return on your investment.
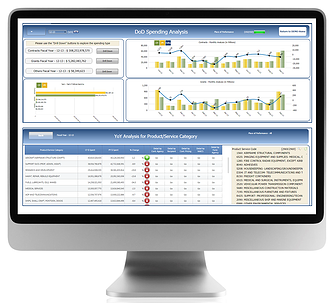
 To receive a Software Demonstration or Request Access to our Online Interactive Trial that features a sample Department of Defense (DoD) Spend Analytics application to help analyze procurement data from FPDS-NG (Federal Procurement Data System - Next Generation) to be able to explore Year of the Year (YoY) spending by product/service code, contracting agency, recipient, NAICS code and geography.